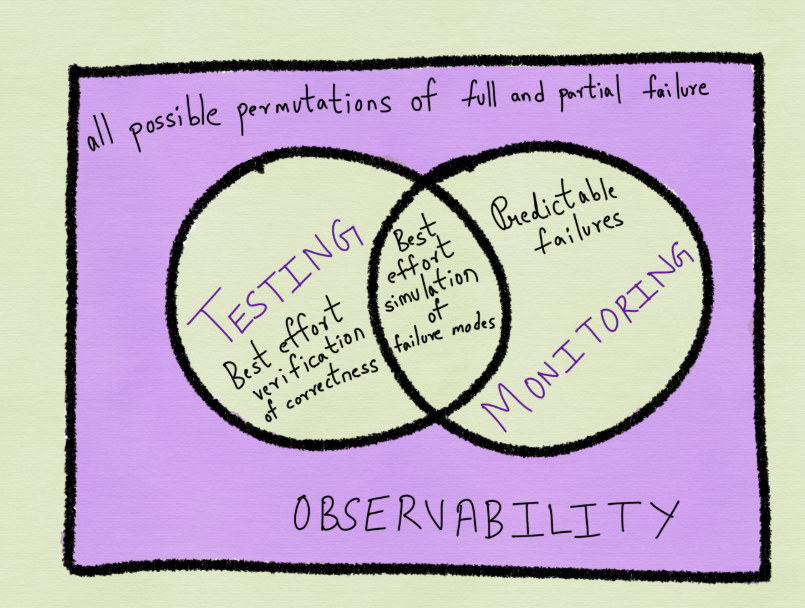
The first question that we as an industry have to address is whether or not the term “Observability” actually means anything, and if it does mean something, how is that something different and better than what all of the vendors had a year ago before everyone started marketing the term Observability. One school of thought is that every vendor who has some combination of metrics, logs and traces has observability. That means that pretty much every modern APM vendor already has Observability, and Observability is just a new way of talking about something that has been around for at least a year.
What Does Observability Really Mean?
Denigrating Observability to a marketing term is not the right thing to do. Observability means the following unique things which no vendor covers in their entirety today:
- Continuous and comprehensive collection of code profiles, metrics, logs, traces, and dependencies for every unit of work (transaction, batch job, etc.) that the business cares about. So if your application executes 5,000 transactions in a second, the monitoring system understands each one of them individually, and collects code profiles, metrics, logs, traces and dependencies for each one of them individually.
- A big data back end that can handles this volume of data, and the diverse data types that comprise code profiles, metrics, logs, traces and dependency maps. This requirement alone makes every vendor whose back end consists of a cobbled together set of open source databases like Cassandra and Elastic into a legacy solution.
- A relationship engine that automatically calculates the relationships and dependencies for each unit of work of interest. A relationship can be the flow of an N-Tier transaction through an application to its services and databases, a set of traces and their respective spans, a “runs on” where a VM is running on a particular host, or a Kubernetes Node is running on a particular Pod (and contending for resources with other VM’s or Nodes), or simply a membership (this transaction ran in this VMware Data Center or this AWS Region).
- Instant and automated instrumentation. If a new microservice is deployed into production, the monitoring system should instantly detect its presence and automatically instantiate the appropriate (for the correct language, JVM, and framework) instrumentation. Manually instrumenting code or installing an agent after the fact is simply not good enough anymore.
- AI based root cause that is actually useful and that actually works as desired. The comprehensive and deterministic data that is a requirement for Observability to exist is the necessary pre-condition to AI that works, since attempting to do root cause upon statistical estimates results in the classic “garbage in, garbage out” problem.
Notable Vendor Innovations in Observability
While you cannot buy a complete Observability solution as outlined above from any single vendor, some very important innovations and progress have been brought to market:
- IBM (Instana) and Dynatrace have both entirely rewritten their agents to deliver completely automated instrumentation. This means that the agent senses what is running in the container or the JVM and automatically injects the correct instrumentation. The benefit of this approach is that once the agent is installed in the OS instrumentation of the application is fully automatic, and there is no configuration required for variations in languages, JVM’s and application frameworks.
- Instana is able to collect, process, analyze and provide results in the user interface for one second metrics. This is as close to comprehensive metric instrumentation as anyone has gotten. Everyone else is at the one minute interval.
- New Relic has rebuilt their entire back end, which it now calls the New Relic Database (NRDB). This is the first monitoring back end from a major APM vendor custom built to meet the needs of an Observability Platform. With Grail, Dynatrace has delivered the most comprehensive and capable back end in the Observability industry.
- New Relic has acquired Pixie Labs, and appears to be building a language independent continuous profiling agent around the Pixie EBPF code base.
- Dynatrace, Instana, New Relic and Datadog have all delivered automated (zero coding required) implementations of OpenTracing. You just install their agents and the agents implement the tracing for you.
- Elastic has acquired Optimize which is now the basis of the Elastic Continuous Profiler.
Ranking the Vendors in Observability
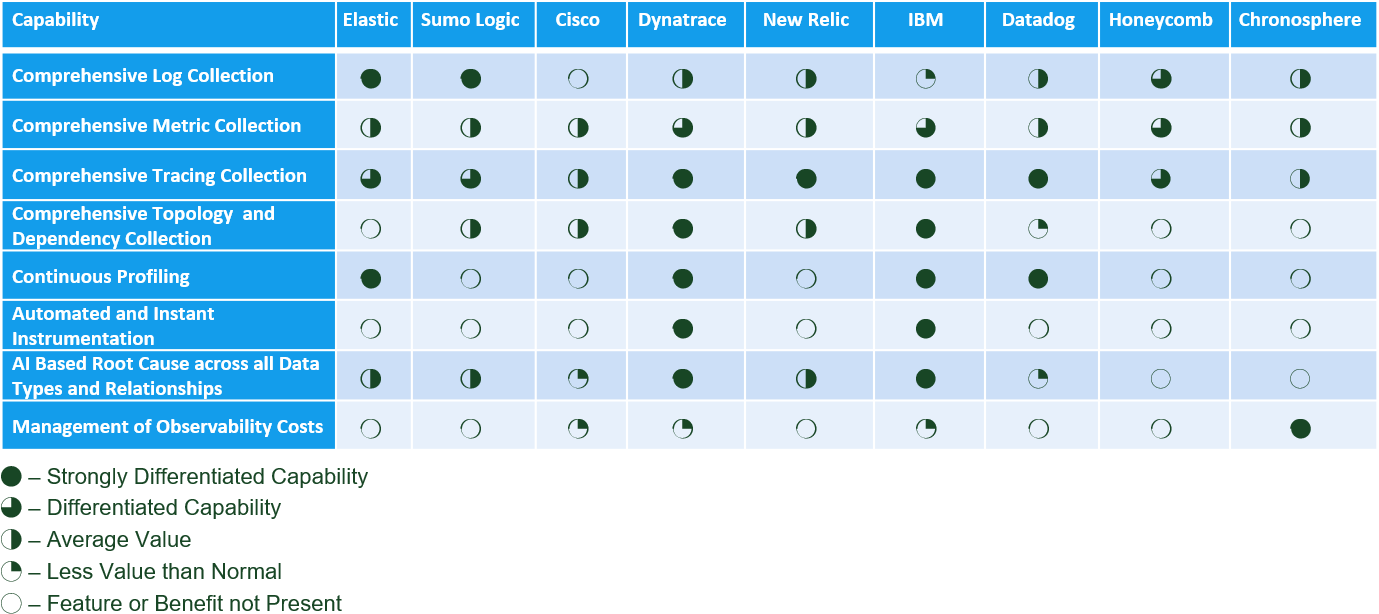
If you accept the above definitions of Observability, then no vendor has it today. This is true for the simple reason that no vendor has automated and comprehensive collection of code profiles, metrics, logs, traces and dependencies for every unit of work in the application that the business cares about. The offerings today either require manual code instrumentation (which is a poor use of developer resources) or collect data every minute instead of for every unit of work. The exceptions here are traces where pretty much everyone has comprehensive tracing (which is really only relevant for microservices based applications), and Instana who can collect, analyse and present data at the one second interval. This leads to the ranking table below. It is important to note that massive investments are being made by the respective vendors on the front of Observability, and the associated analytics and automation, and that the table below will therefore likely get updated quite frequently.
Who is Where in Observability (Click Table to Expand)